|
LUCC Lab #3 Group: Mason Kirkpatrick and Rose Mayer Background This lab concludes our investigation of land use and cover change on Lewis and Clark’s campus and within the surrounding areas. Upon completing the first two labs investigating land use and cover change we were to compile all of our data that each of the twelve groups had collected. This lab analyzes this data and allows us to infer what it could show us about land use and cover change in these areas. Our site was one of the four stationed around Lewis and Clark’s campus with our centroid being in the Estate Gardens on the lawn just east of the reflecting pool. 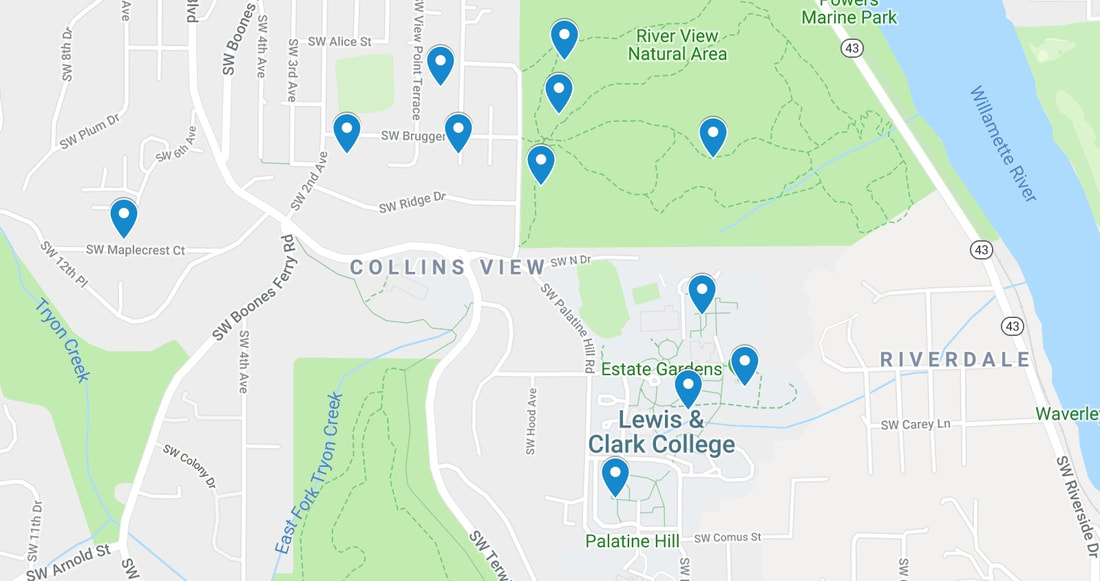 Procedure/Analysis First we compiled all of the lab data from the prior two labs into one spreadsheet. Then we categorized the data from each centroid based on its location (i.e Lewis and Clark campus, Riverview Natural Area, and the Collins View neighborhood). Then we found the ranges for both temperature and humidity for each centroid to add to the detail of our data. From this list of data we created graphs to compare and analyze the data from our centroid to the others on Lewis and Clark’s campus as well as the averages for the entire area. We created a graph to compare our data to the rest of it on the basis of minimum, maximum, average, and range of temperature and humidity. Results We were able to observe that our data most closely aligns with the average data of the Collins View neighborhood as well as Lewis and Clark’s campus. While varying greatly from the average data of Riverview natural area. This make sense because both Lewis and Clark’s campus as well as Collins View are residential areas that experience a good amount of foot traffic. While Riverview is a natural area that is not populated and is protected by the government. The most significant of our findings came in the form of our humidity data. Our maximum humidity was greater than the average humidities of Collins View, Riverview Natural Area, and Lewis and Clark’s Campus. Our minimum humidity was greater than the average humidities of only Lewis and Clark’s campus and Collins View. With our average humidity being less than both Collins View and Riverview but greater than the average humidity of Lewis and Clark’s campus. Finally, our humidity range was only less than Collins View while being greater than the range of the other two areas. This shows us that while our humidity was quite high, there was less of a difference between our minimum and maximum values than that of Collins view. 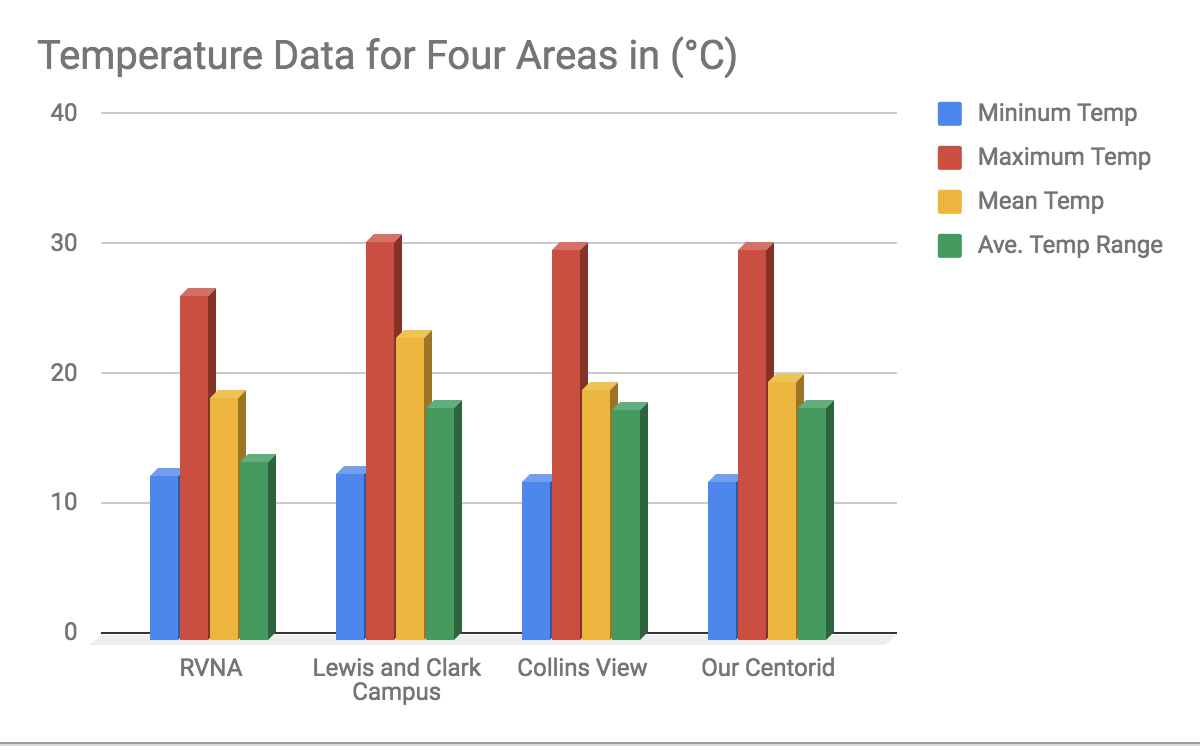 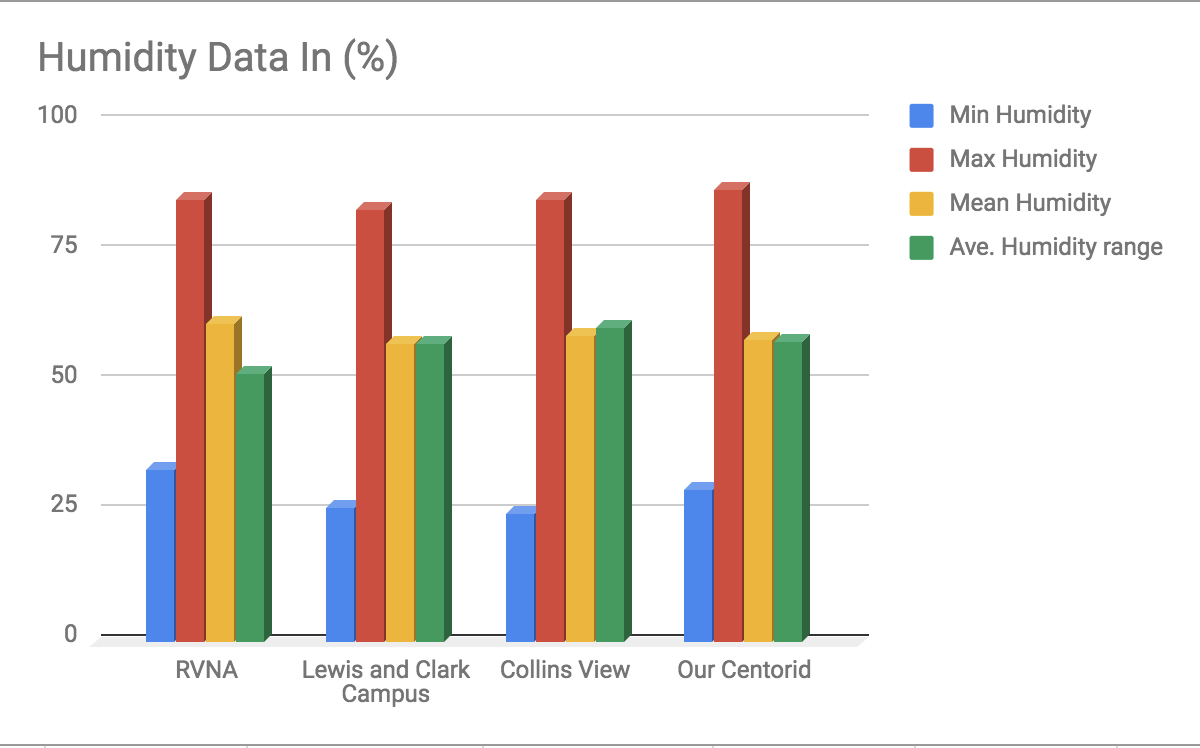 For our canopy and ground cover data, our tallest object was larger than all other areas. Our ground cover was as well because our centroid was in a human maintained area. Thus, the ground was completely covered. We had no canopy cover because our centroid was contained in a large grass lawn with no overhanging trees or shrubbery. 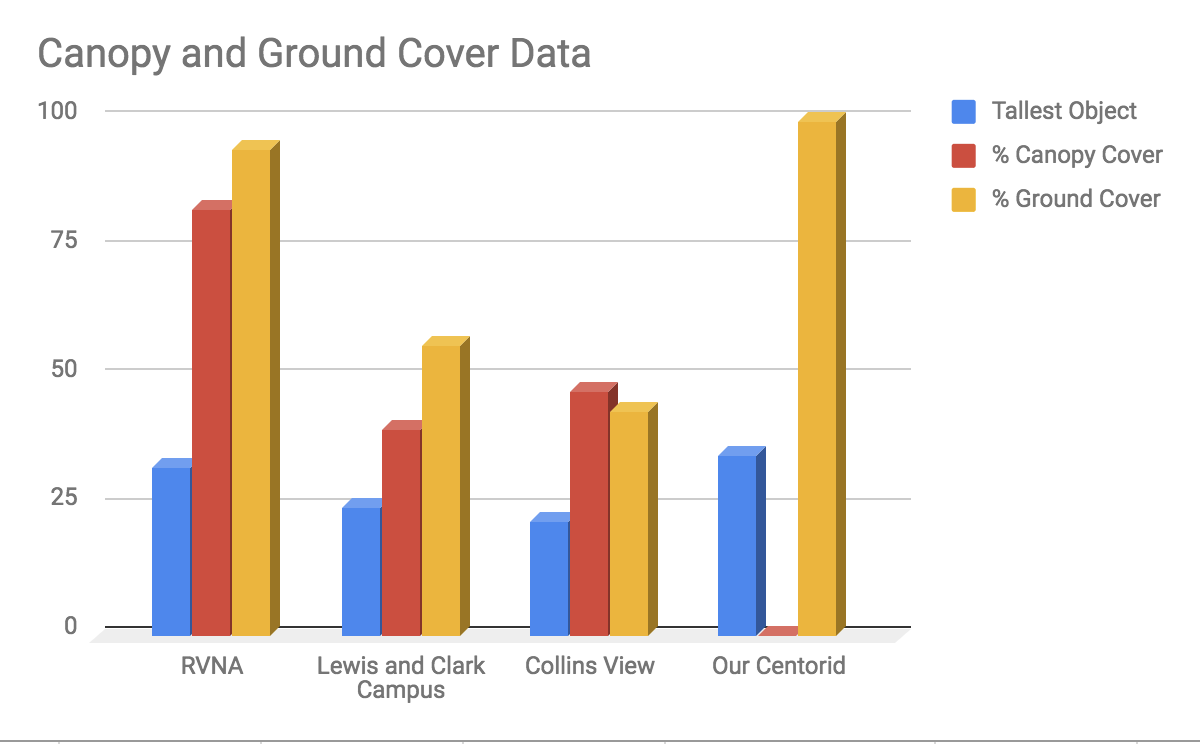 Discussion
The greater significance of our data displays how much values like humidity and temperature as well as ground and canopy cover can vary greatly over a small area. On campus other centroids were only a couple hundred meters from ours yet their data was greatly different than ours. Over a few square miles surrounding campus our data also varied greatly. This appears to be due to the amount of difference between how different ecosystems operate within a relatively small space. This great variance in data over a small area poses a problem for larger studies. When doing research relating to land use and cover change it seems illogical to conduct research on a mass scale. The only way to get accurate results would be to gather and crowdsource data from smaller studies such as ours because of how variable results our and how different areas can be within a close proximity to each other. Riverview experienced the most canopy and ground cover because it is a natural protected area. Collinsview experienced the second most in these categories. Though it is a residential area it has a high level of canopy cover with some sparseness due to houses. It’s ground cover is high as well because a lot of the ground is maintained by the owners of the space who want to have green lawns. Lewis and Clark’s campus is last in these categories because there are many large buildings to interfere with canopy coverage as well as man made paths that reduce ground coverage. Our data does not follow these trends because it is totally manicured by humans specifically to have complete ground cover and no canopy cover. Changes to the protocol that could be made would to have more accurate GPS as well as measuring equipment. If our equipment were more accurate we could have better outlined our centroid so that we would have better, more clear, data.
0 Comments
Leave a Reply. |
AuthorMason Kirkpatrick. Class of 2021 Archives
November 2018
Categories |
 RSS Feed
